So far, three blazars (PG 1553+113, PKS 2155–304, and PKS 0537–441) have been reported having quasi-periodic variability in gamma-ray fluxes with the significance of ≥3σ. In particular, We reported a γ-ray quasi-periodic variability in PKS 2155–304 with a significance of 4.9σ. This three blazars are HBLs. HBL usually has a “clean” environment around the jet, and the γ-rays are produced by SSC. It is interesting to search for quasi-periodic variabilities in other subclasses of blazars, e.g., flat-spectrum radio quasar (FSRQs). In this work, we search for γ-ray and optical periodic modulations in distant FSRQ PKS 0426–380 (the redshift z = 1.1). Using two techniques (i.e., the maximum likelihood optimization and the exposure-weighted aperture photometry), we obtain γ-ray light curves from Fermi-LAT Pass 8 data covering from 2008 August to 2016 December. We then analyze the light curves with the Lomb–Scargle periodogram and the weighted wavelet Z-transform. A γ-ray quasi-periodicity with a period of 3.35 ± 0.68 yr is found at the significance level of ≥3.6σ. The optical–UV flux covering from 2005 August to 2013 April provided by the ASI Science Data Center is also analyzed, but no significant quasi-periodicity is found. It should be pointed out that the result of the optical–UV data could be tentative because of the incompleteness of the data. Further long-term multiwavelength monitoring of this FSRQ is needed to confirm its quasi-periodicity. 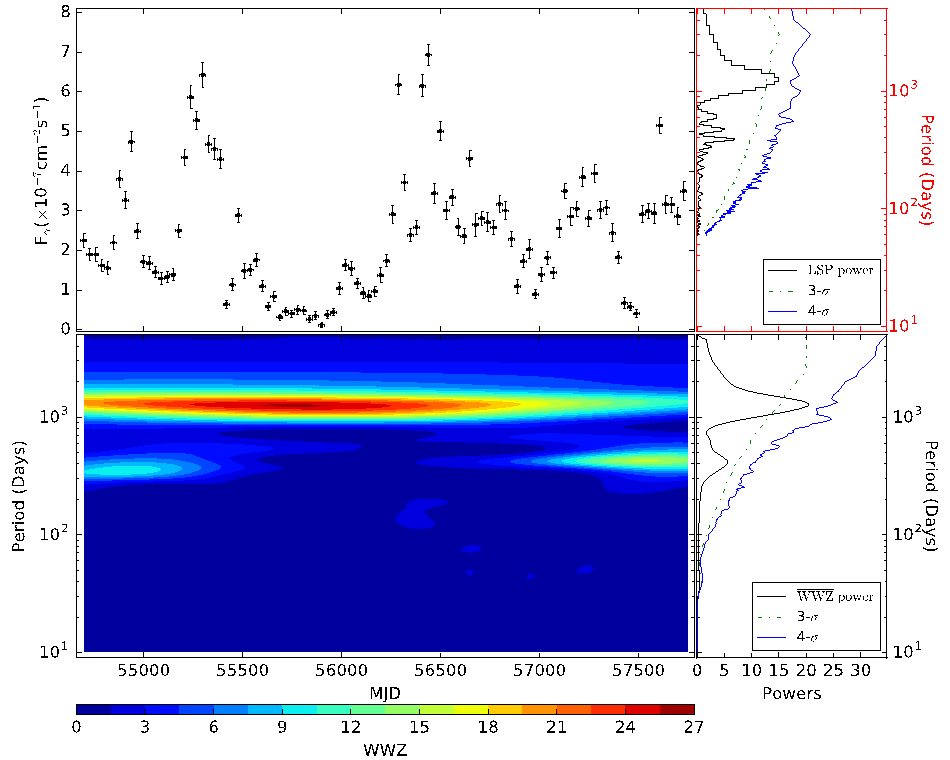
By with ZHANG Pengfei Figure 1. Upper left panel: likelihood gamma-ray light curve of PKS 0426–380 above 100 MeV with the 1-month bin. Upper right panel: corresponding LSP power spectrum; the blue solid line and green dashed line represent the 4σ and 3σ confidence level, respectively. Lower left panel: 2D plane contour plot of the WWZ power of the monthly light curve. Lower right panel: the black solid line represents the time-averaged WWZ power; the blue solid line and green dashed line represent the 4σ and 3σ confidence level, respectively. This work by Zhang Peng-fei and Yan Da-hai et al., has been published in Astrophysical Journal (2017, ApJ, 842, 10). Detailed information of the paper can be found at: http://iopscience.iop.org/article/10.3847/1538-4357/aa7465/meta |
