It is well known that H II galaxies (HIIGx) and Giant extragalactic H II regions (GEHR) are physically similar systems. H II galaxies and the H II regions of galaxies are characterized by rapidly forming stars surrounded by ionized hydrogen, the presence of which leads to their naming convention. GEHR have massive bursts of star formation, but are generally located in the outer discs of late-type galaxies. HIIGx are also massive and compact aggregates of star formation. The total luminosity of an HIIGx is almost completely dominated by the starburst. Since the starburst component can reach very high luminosities, HIIGx can be detected at relatively high redshifts (z > 3). What really makes these galaxies interesting as standard candles is the existence of a correlation between the luminosity L(Hβ) in Hβ and the ionized gas velocity dispersion σ. Using a sample of 25 high-redshift HIIGx, 107 local HIIGx, and 24 GEHR, Wei et al. (2016, MNRAS, 463, 1144) have confirmed that the correlation between the Hβ-line luminosity and ionized-gas velocity dispersion can indeed produce a luminosity indicator with sufficient reliability to construct the Hubble diagram at redshifts beyond the current reach of Type Ia supernovae (see Fig. 1). They have optimized the cosmological parameters by maximizing the likelihood function. In the flat LCDM model, the resulting Hubble diagram leads to a best-fitting value omega_m= 0.40+0.09/−0.09. A statistically acceptable fit to the Hubble diagram with wCDM (the version of LCDM with a dark-energy equation of state w_de ≡ p_de/ρ_de rather than w_de = w_Lambda = −1) is possible with omega_m = 0.22+0.16/−0.14 and w_de = −0.51+0.15/−0.25. These values, however, are not fully consistent with the concordance values. 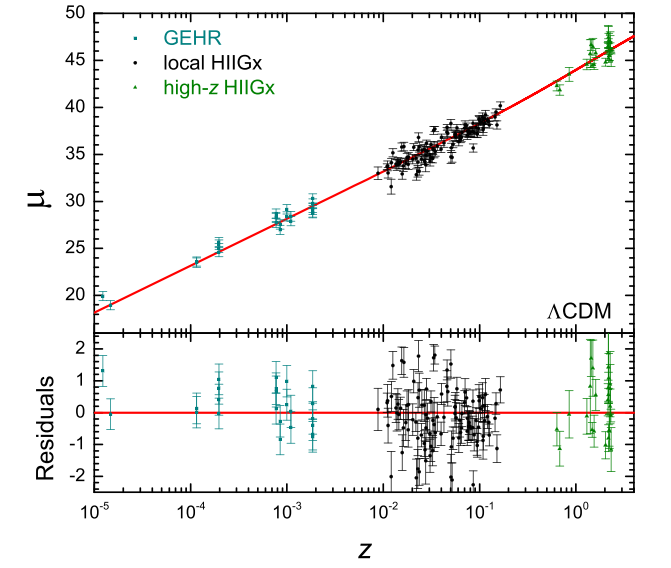
With By WEI Junjie Figure 1. : Hubble diagram and Hubble diagram residuals for the 156 combined sources (including 25 high-z H II galaxies, 107 local H II galaxies, and 24 Giant Extragalactic H II Regions) optimized for the flat CDM model. The work by Jun-Jie Wei, Xue-Feng Wu, and Fulvio Melia has been published in Monthly Notices of the Royal Astronomical Society, please see MNRAS (2016), 463, 1144-1152 for more details (http://mnras.oxfordjournals.org/content/463/2/1144.full.pdf). |
