S0 Galaxy
We present a global analysis of kinematics and metallicity in the nearest S0 galaxy, NGC 3115, along with implications for its assembly history. The data include high-quality wide-field imaging from Suprime-Cam on the Subaru telescope, and multi-slit spectra of the field stars and globular clusters (GCs) obtained using Keck-DEIMOS/LRIS and Magellan-IMACS. Within two effective radii, the bulge (as traced by the stars and metal-rich GCs) is flattened and rotates rapidly (v/sigma > 1.5). At larger radii, the rotation declines dramatically to v/sigma ~ 0.7, but remains well-aligned with the inner regions. The radial decrease in characteristic metallicity of both the metal-rich and metal-poor GC subpopulations produces strong gradients with power law slopes of -0.17 +/- 0.04 and -0.38 +/- 0.06 dex per dex, respectively. We argue that this pattern is not naturally explained by a binary major merger, but instead by a two-phase assembly process where the inner regions have formed in an early violent, dissipative phase, followed by the protracted growth of the outer parts via minor mergers with typical mass ratios of ~ 15-20:1.
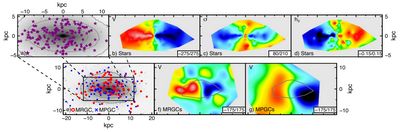
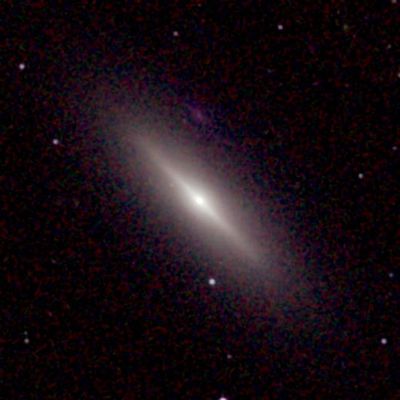
Fig. 1.— Spatial and kinematic maps of NGC 3115. Top: i-band image (a) with SKiMS (stellar light) measurement locations (purple stars). Maps of stellar rotation (b), velocity dispersion (c) and h3 (d), each sharing the same spatial scale as (a). Bottom: Zoomed-out view (e) with spectroscopically confirmed metal-rich (red circles) and metal-poor GC (blue crosses) locations. The inset rectangle denotes the region shown in (a) where selected i-band isophotes are also overplotted. Rotation maps, made using the MRGC (f) and MPGC (g) datasets, with the same spatial scale as (e), and overlaid by an outline of the zoomed-in stellar fields from (b)–(d). The kinematic maps were created using kriging techniques for statistically reconstructing sparsely-sampled functions, using “interpolation” and “fitting” approaches for the stellar and GC datasets, respectively (Press et al. 2007). The minimum/maximum color-bar scaling is recorded in the
bottom right corner of each panel (all in units of km s−1 except for (d), which is dimensionless). While these maps effectively convey the broad-brush kinematic behavior, we note that interpolating sparse data sets may lead to over-smoothing and anomalous small-scalestructure, particularly at larger radius.
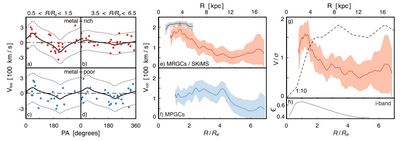
Fig. 2.— Rotation models for NGC 3115. Panels (a)–(d) plot line-of-sight velocities in two radial bins (R/Re 1, 5) versus position angle for MRGCs (top) and MPGCs (bottom). Solutions for rotational velocity (Vrot: solid black curves) and velocity dispersion () are determined for each dataset using the kinemetry method described in the text (dotted curves denote Vrot ± 2). Smoothed rolling-fit rotational profiles with uncertainty envelopes are shown for the stellar light (black curve) and MRGCs (red curve) in (e), and for the MPGCs (blue curve) in (f). In (g) the v/ profile of NGC 3115’s MRGC subpopulation (red curve) is compared against a simulated merger remnant with a 1:10 mass-ratio (dashed: Bournaud et al. 2005). (h) contains the i-band ellipticity profile.

Fig. 3.— Color distributions (g − i)0 of point sources around NGC 3115. Left: Overall photometrically-selected GCs (open histogram) and of stellar contaminants (filled; as measured at R/Re > 14). Middle: Resulting true GCs (open) after contaminant subtraction. Also shown are the spectroscopically confirmed GCs (filled). Right: Color (left-axis) and [Fe/H] metallicity (right-axis; see text for details) versus radius. Individual GCs are shown as squares according to the legend at right. Solid curves denote rolling fits of the peak color of each GC subpopulation as estimated from a combination of mixture modeling methods (Ashman et al. 1994) and an iterative Monte Carlo scheme to correct for the contaminant color-bias. Associated error envelopes reflect both statistical and photometric uncertainties. We convert the peak color difference between the inner (1–2 Re) and outer (> 8 Re) portions of each GC system into merger mass-ratios (see text), with sample values shown on the right-hand side.
See the website for more details. http://arxiv.org/abs/1106.0745v1 (SY)
